Be Prepared for Your City’s Next Disruptive Event

ClearGuide® is a powerful traffic analytics solution that can help transportation agencies plan for disruptions in traffic flow caused by major events. When sporting events, festivals, concerts, seasonal travel, or adverse weather conditions are forthcoming, ClearGuide offers:
- Predictive analytics
- Real-time hotspot identification
- Before-and-after studies
- Post-event analysis
The total solar eclipse on April 8 traversed 15 U.S. states. The highly anticipated event attracted formidable traffic congestion as record travel volumes flooded regions surrounding and in the path of totality.
 Carbondale, Illinois bills itself as the Eclipse Crossroads of America. Congestion caused by tourists increased steadily throughout the 24 hours before the eclipse arrived.
 In Cleveland, a giant eclipse-viewing party was held at the Guardians’ baseball stadium. The resulting change in traffic volume is evident.
The tools in ClearGuide make it easy to prep for and report on key findings from disruptive events such as the total solar eclipse. The Iteris ClearGuide Team designed the software to help ensure planners are well prepared for any traffic challenges that may arise during major events.
Agencies can use ClearGuide to:
- Diagnose changes in travel patterns
- Visualize problem areas
- Optimize mobility with real-time data and mapping software
- Report before-and-after congestion countermeasure results
For example, ClearGuide’s Multi-Route Reports and Anomalies are great places to start in minimizing avoidable delays and traveler complaints.
The Multi-Route Performance Report lets you choose up to three metrics to report on across your selected routes. Example: Rank corridors by highest travel time during peak commuting hours.
The Time Comparison Report lets you see how a given mobility measure has changed over time along routes. Examples: Before-and-after studies; comparing similar times across years.
The Report Card summarizes performance during the a.m. peak, midday, and p.m. peak along selected routes. Example: Regular reporting on the mobility of designated routes.
The Anomalies layer on the ClearGuide real-time traffic map lets you visually understand the difference between typical traffic and current traffic, letting you quickly see where speeds are slower or faster than normal.
To see a free demo of ClearGuide in action, please click here.
 X
(Twitter)
X
(Twitter)
 Facebook
 LinkedIn
 Copy
Link
Copy
Link Email
EmailRelated Posts
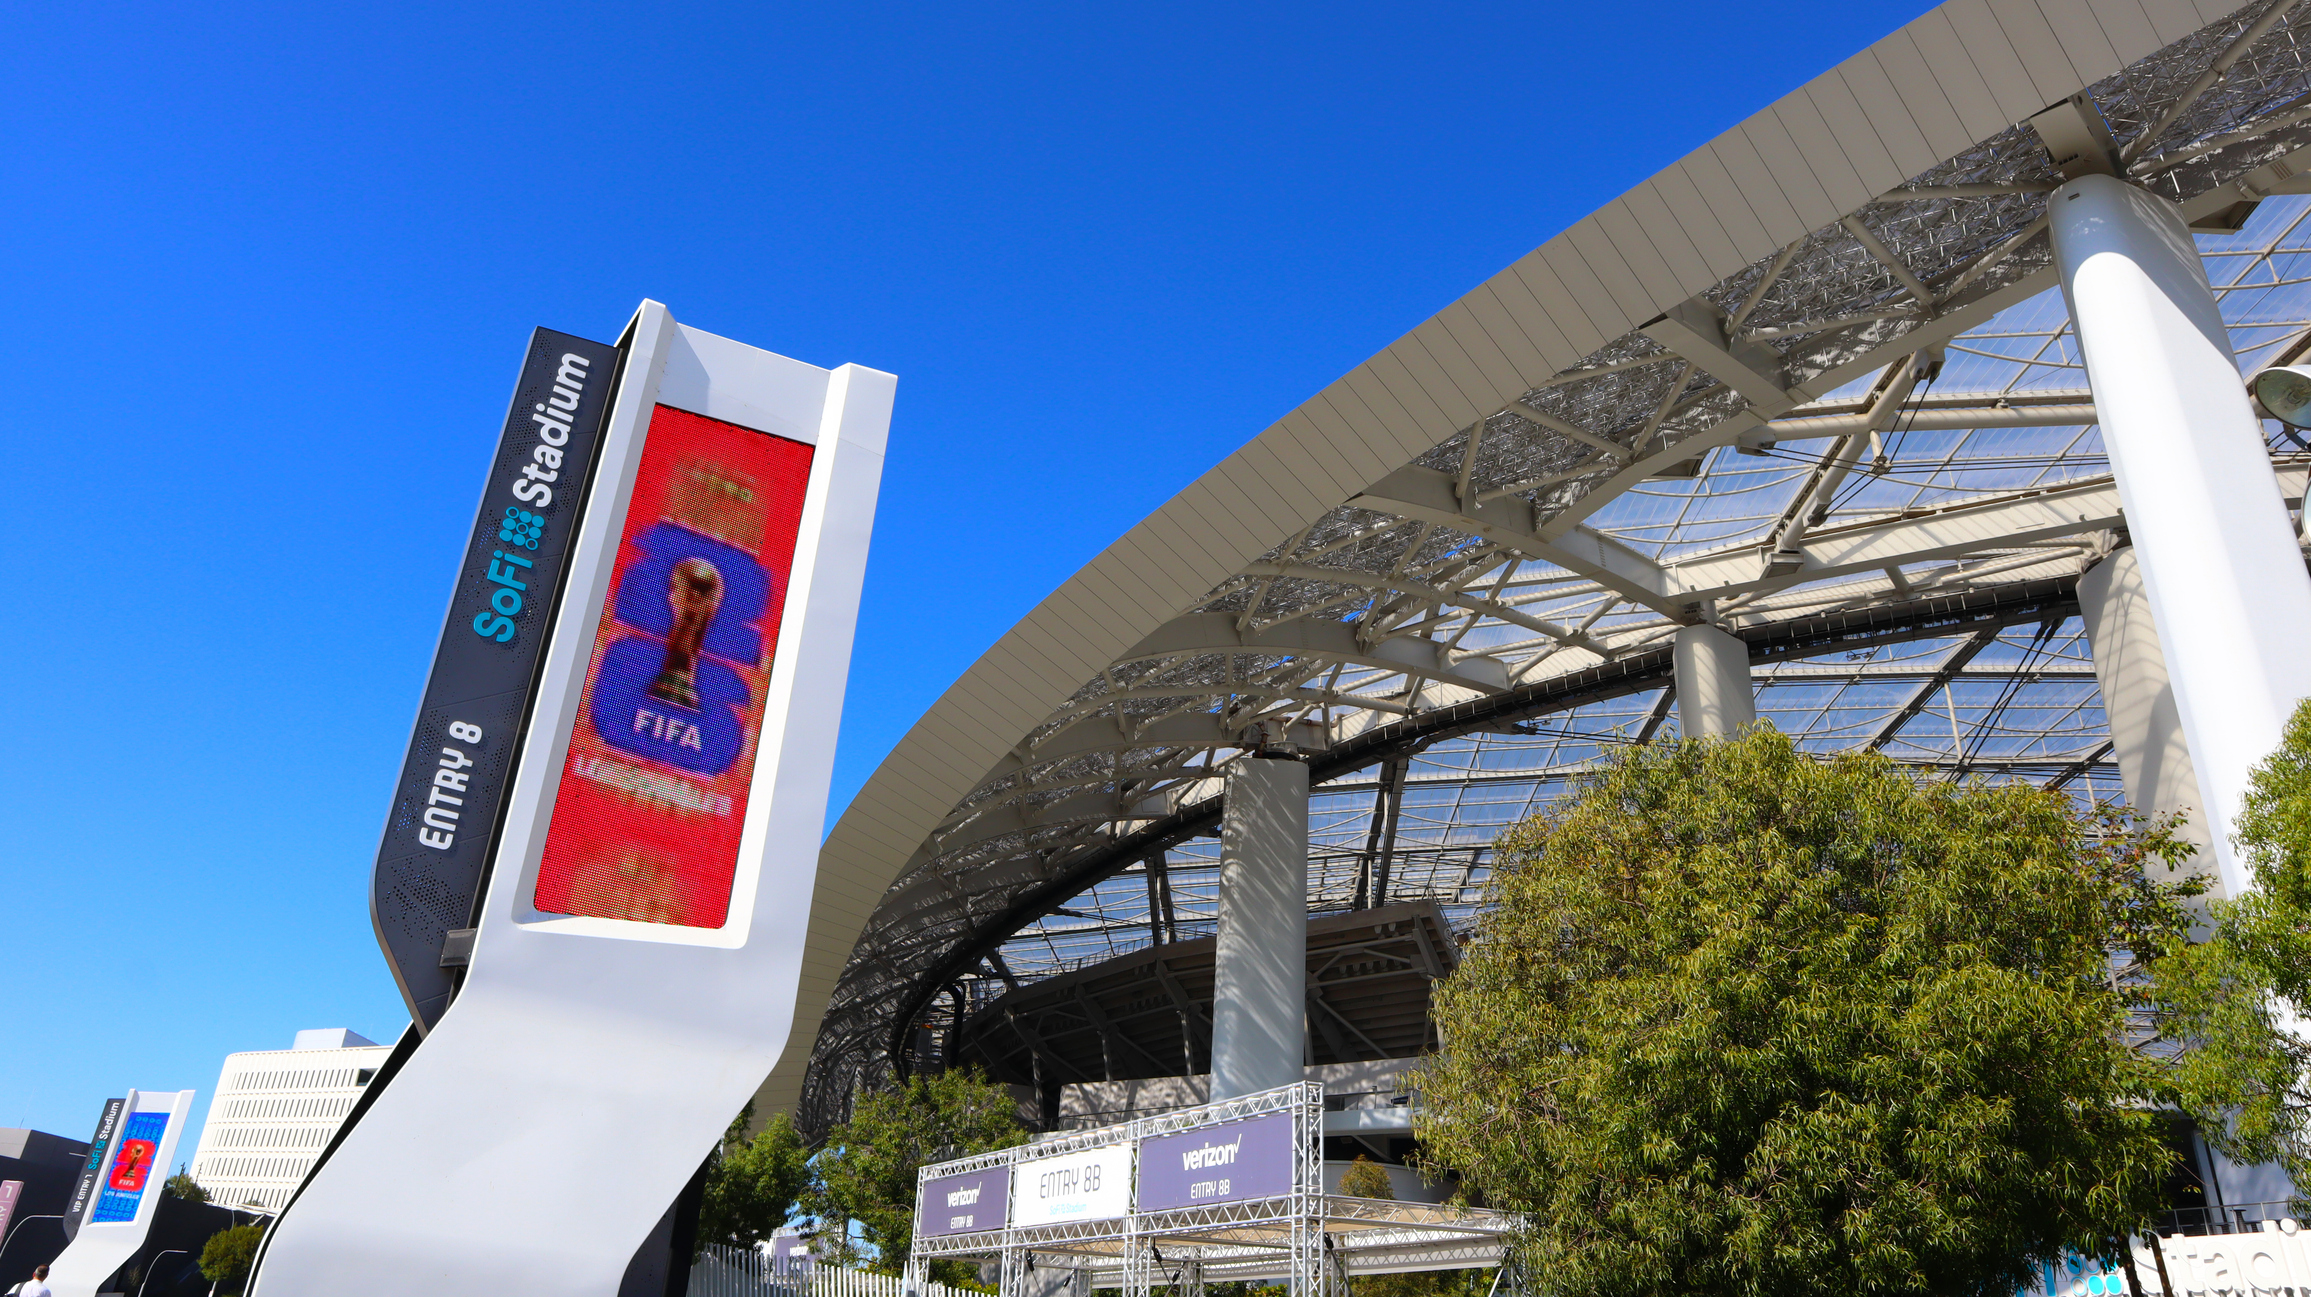
How LA Metro Is Managing World Cup Traffic with ClearGuide
ITS America 2026: Real Conversations, Real Momentum and What Comes Next