How LA Metro Is Managing World Cup Traffic with ClearGuide
As the FIFA World Cup 2026 unfolds, it presents a logistical challenge unlike many other sporting events. Spanning three nations, the event has expanded to 48 teams playing 104 matches, drawing millions of international visitors.
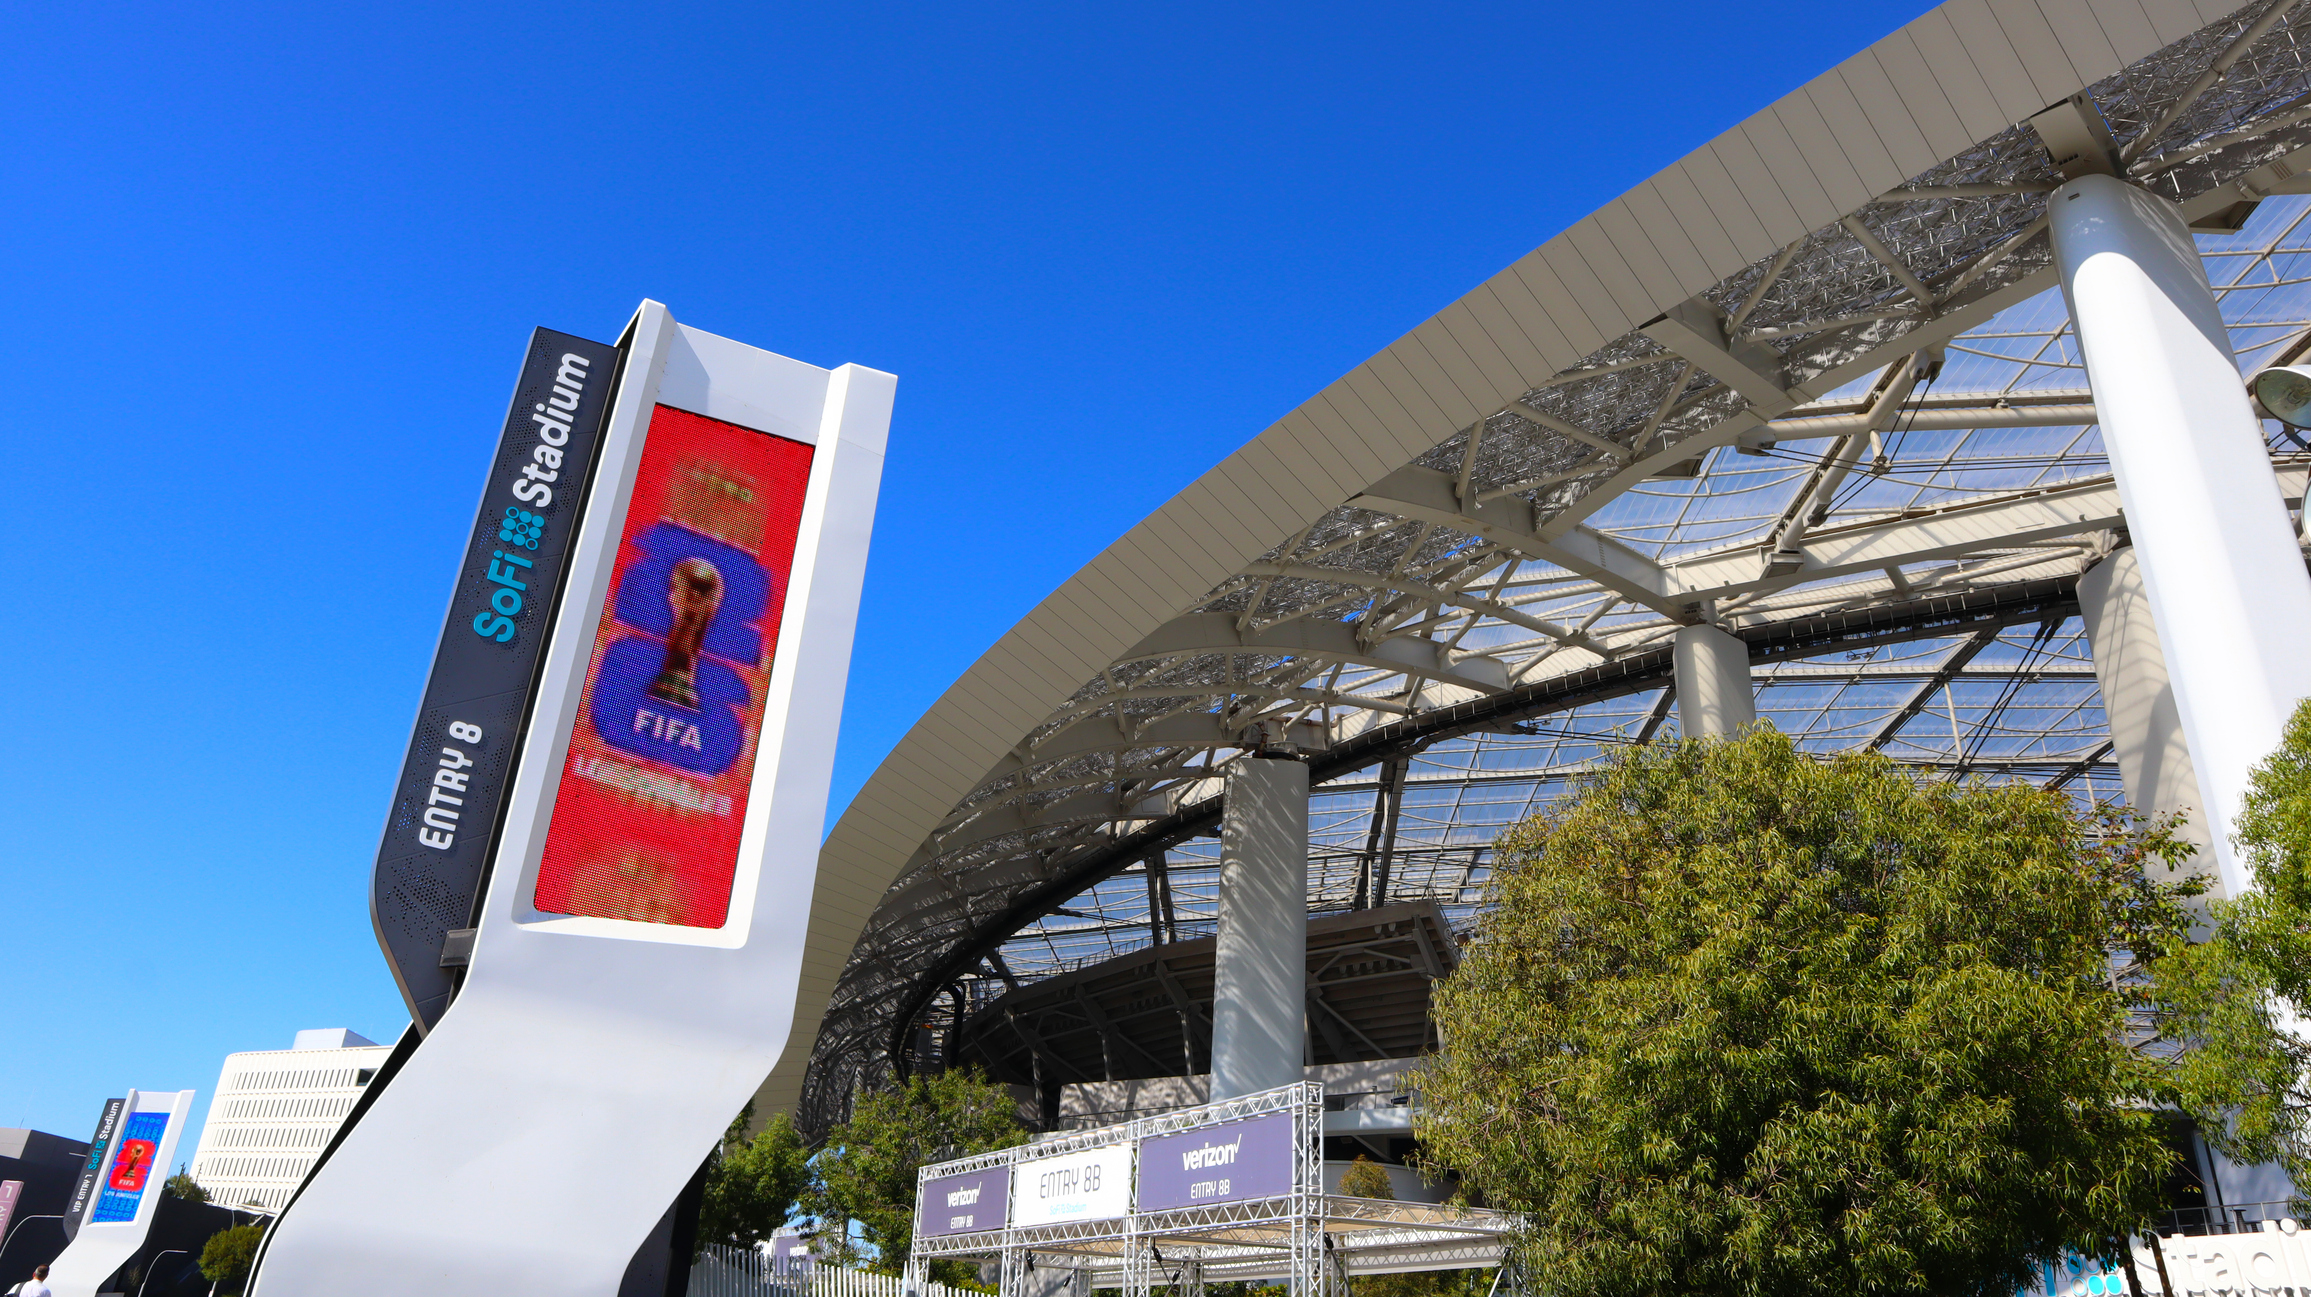
In Southern California, the Los Angeles County Metropolitan Transportation Authority (LA Metro) is responsible for moving these massive crowds safely across a sprawling county of 10 million residents. With eight marquee matches scheduled at SoFi Stadium (Los Angeles Stadium) in Inglewood, LA Metro is tasked with maintaining public safety and vehicle mobility—hinging on precise, proactive traffic management.
LA Metro’s Perspective
To handle this operational burden, LA Metro is relying heavily on Iteris ClearGuide®, an advanced traffic analytics platform. For a regional entity like LA Metro, which serves simultaneously as a planning, funding, and operations agency across dozens of distinct local municipal borders, coordinating traffic responses across a massive metropolitan setting is notoriously complex.
Rather than relying on rigid, calendar-based retiming schedules or reactive field adjustments, ClearGuide gives the LA Metro team a single platform to manage event congestion. This allows their engineers to also lean on on ITS experts from Iteris and help plan for major disruptions, monitor regional roadway conditions in real time as tourists and fans flood the stadium, and conduct comprehensive post-event reporting to optimize the next match day.
The real-world value of this comprehensive data ecosystem was demonstrated during the 2025 FIFA Club World Cup held at the Rose Bowl in Pasadena, where LA Metro used ClearGuide to actively track traffic flow before, during, and after the matches.
According to Ed Alegre, PTP, Deputy Executive Officer at LA Metro’s Intelligent Transportation Systems Group, having immediate access to these historical and real-time data sets has revolutionized how the agency collaborates with local municipal partners.
"ClearGuide has been a great benefit for us as we plan for these mega-events, and as we do our day-to-day analysis as well," Ed Alegre of LA Metro notes. "It really helps us and our local agency partners in making better decisions for the movement of people and goods in LA County."
The historical data allows teams to model traffic scenarios and deploy preplanned signal adjustments on key arterials, while post-event analysis provides the exact reporting metrics needed to show what worked and where adjustments are required for future matches.
To maximize these capabilities, agencies frequently pair the software with services from Iteris consulting. This combination lends expert analytical support to translate cloud data into optimized local action.
What the Data is Showing So Far
Now that games are underway, the surge is no longer theoretical but already showing up in real traffic patterns. As residents of that area know, any breakdown in the flow of traffic can quickly cascade into severe arterial gridlock, disrupting emergency services and compromising the local quality of life.
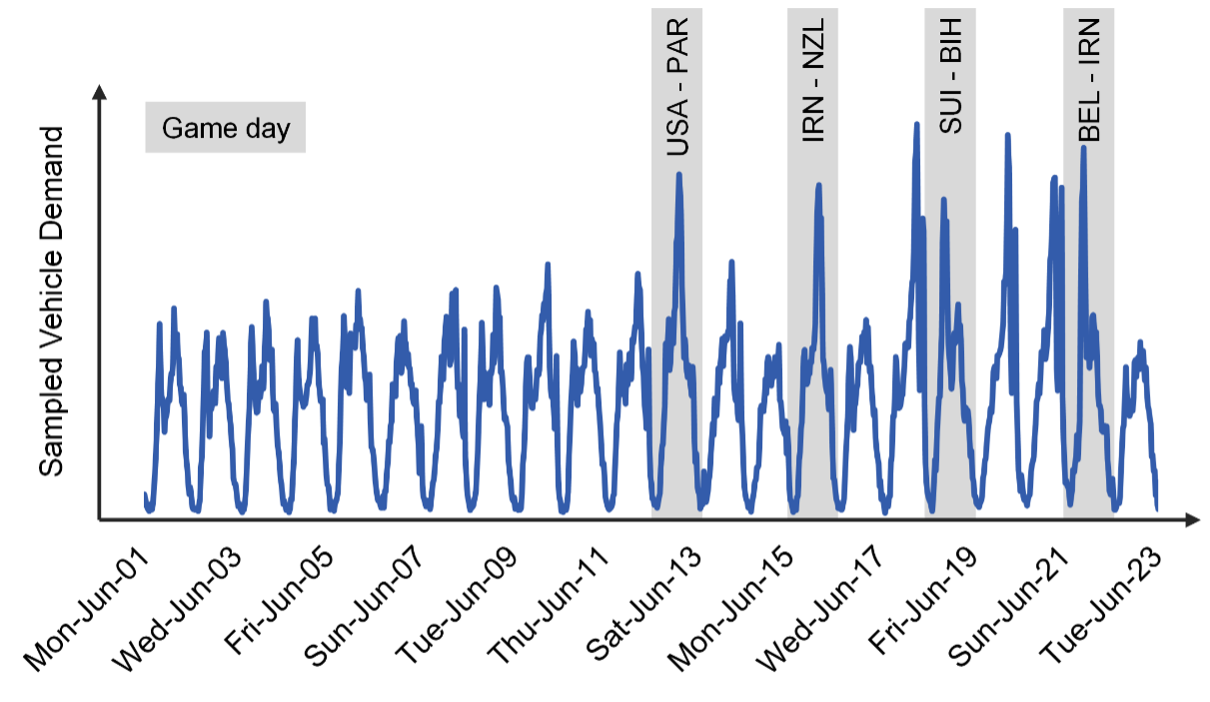
Five games have already taken place, and the increase in traffic is evident. Across 25 signalized intersections surrounding the stadium, peak vehicle demand increased over 220% between normal and game days.
 PHOTO
FIGURE 1: ClearGuide vehicle demand data spikes for the first four World Cup game days in Los Angeles
PHOTO
FIGURE 1: ClearGuide vehicle demand data spikes for the first four World Cup game days in Los Angeles
A Different Approach
One of the key advantages to ClearGuideis the ability to deliver detailed, 24/7 traffic insights without requiring any physical in-field hardware or local intersection connectivity.
Traditional traffic management requires a massive investment to install and maintain physical roadside sensors, radar units, or intersection cameras. ClearGuide bypasses this infrastructural constraint entirely by leveraging cloud-connected, anonymized vehicle trajectory (probe) data to continuously monitor speeds, travel times, and intersection delays nationwide.
For FIFA host cities trying to manage the immense traffic influx of a World Cup event, this means comprehensive network coverage can be deployed instantly without waiting on costly, time-consuming construction projects. ClearGuide can support this effort through multiple data sets in map-based modules such as ClearGuide Roadways, ClearGuide Signal Trends, and the ClearGuide Volumes data set. While the Roadways module tracks baseline travel speeds and triggers real-time corridor alerts, Signal Trends uses probe data to calculate movement-level performance, similar to traditional cabinet-based SPM without hardware infrastructure or detection zone limitations.
Game Day vs. Normal Conditions
Looking at early data from the dates of FIFA matches, we can see the differences in traffic conditions clearly. Probe-based roadway analytics provide practitioners real-time visualizations that allow for at-a-glance identification of network congestion. For example, the images below color-code road segments by the percentage of vehicles traveling at free-flow speed. As expected, network conditions significantly differ between no-game and game-day scenarios. This granular information can help agencies perform data-driven decisions on how to use limited resources to improve conditions.
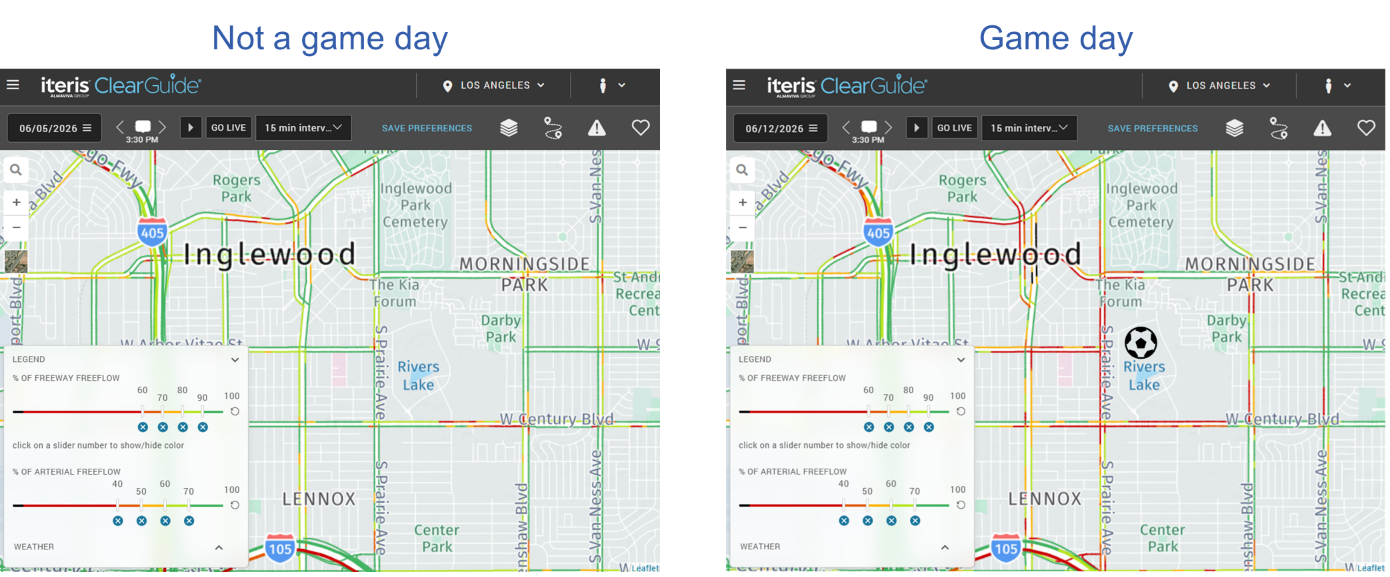 FIGURE 2: Game day data versus the same area one week before with no event
By evaluating median speeds over a month along an adjacent route to SoFi Stadium, detailed comparisons by time-of-day and day-of-week are possible. Specifically, queue-length dynamics can be assessed to locate the start of bottlenecks where congestion mitigation, if possible, could alleviate upstream intersections.
For example, on Friday 6/12, during the U.S. game, queues were almost 2 miles long, starting at Crenshaw Blvd, while usually they are under ½ mile long.
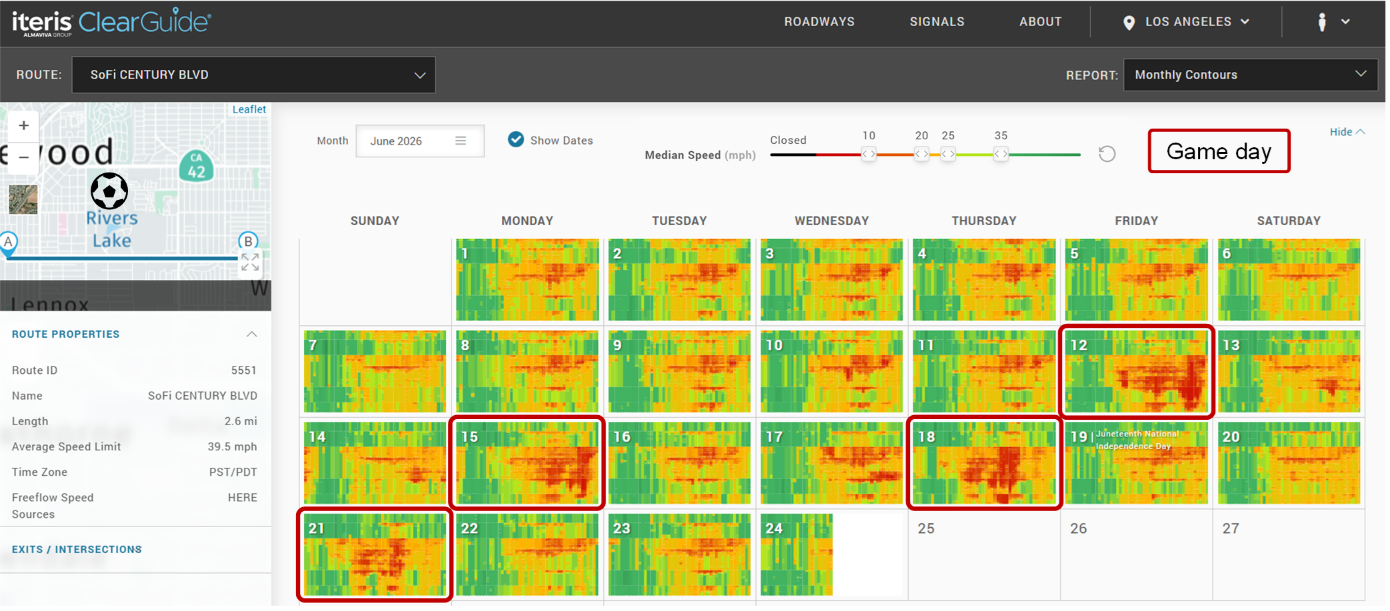 FIGURE 3: Red indicates slower median speed
Where Congestion Is Straining the System
Probe-based SPM allows engineers to see exactly where traffic signal timing is breaking down and causing abnormal conditions. Because the software updates approximately every 15 minutes, operations teams can spot emerging challenges and fine tune signal patterns before localized congestion spiral into widespread gridlock.
The network-wide evaluation below summarizes the change in control delay between no-game and game-day conditions. The most impacted locations are concentrated in downtown and near the stadium, with many signals experiencing delay increases of over 50 seconds/vehicle. This high-level analysis provides practitioners with a triaging tool that helps identify what areas need of further attention.
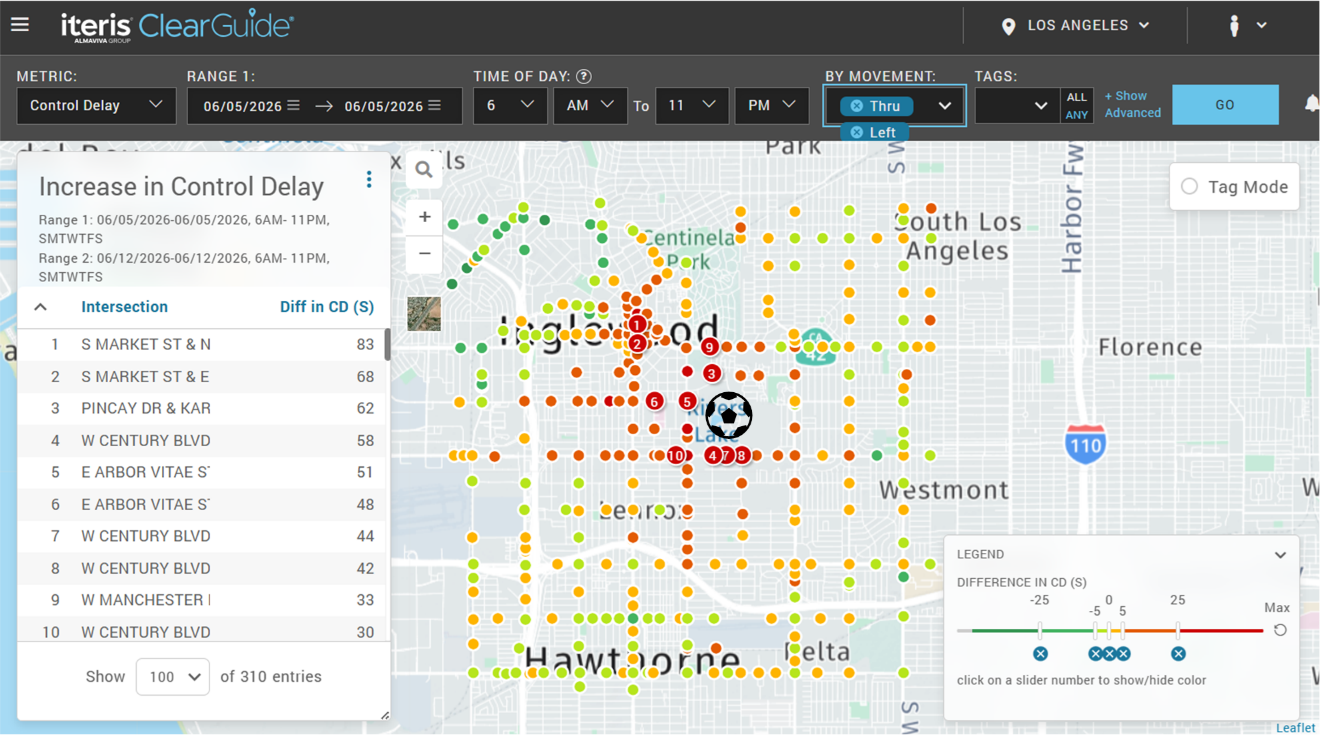 FIGURE 4: Increases in control delay around the stadium area on game day
Then, more detailed analyses at relevant intersections communicate specific conditions at each movement. For example, the image below displays change in split failure percentages at a location near the stadium. Overall, the intersection saw a 12% increase in split failures; however, by evaluating each movement, practitioners may be able to identify retiming opportunities.
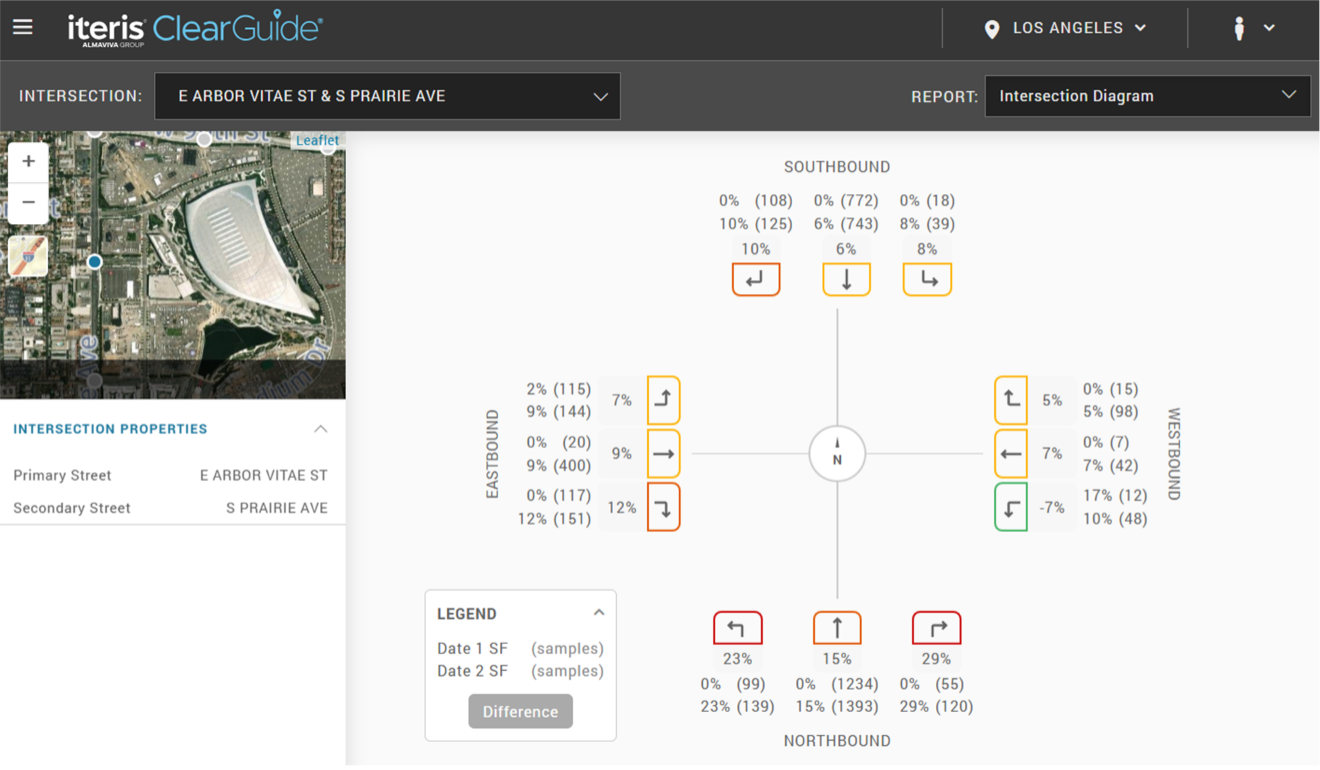 FIGURE 5: Increases in split failures around the stadium on game day
Understanding Not Just Where, But Why Traffic Fails
The ClearGuide Volumes data set can nicely complement speed and signal performance data . In the past, discovering whether a roadway's physical capacity was being breached by excessive traffic required manual vehicle counts or in-field loops.
ClearGuide Volumes utilizes proven machine learning models and curated historical data to provide 15-minute interval traffic volume estimates across the entire network. Combining these precise volume counts with real-time speed data gives planners the granular visibility needed to understand not just where congestion is happening, but exactly why a specific corridor is failing, enabling highly effective traffic and safety countermeasures.
What Other Cities Can Learn
As host cities across North America prepare for the logistical pressure of the World Cup, the data-driven framework established by LA Metro provides a clear operational template. Implementing an analytics platform free of hardware like ClearGuide represents a vital asset for any municipality aiming to guarantee public safety and seamless mobility during major global events.
LA Metro’s reliance on advanced data & analytics tools is part of a much longer, sophisticated vision; the agency is already leveraging ClearGuide to build the foundational logistics for an even larger undertaking: the 2028 Summer Olympic Games. For transportation departments looking to secure their own regional networks, the path forward is being mapped today on the streets of Los Angeles and in other host cities across the globe.
Learn More
Want to see how ClearGuide can support your agency? Schedule a demo to learn more.
 X
(Twitter)
X
(Twitter)
 Facebook
 LinkedIn
 Copy
Link
Copy
Link Email
EmailPost Topics
Related Posts
ITS America 2026: Real Conversations, Real Momentum and What Comes Next
How Agencies are Modernizing Small Intersections