Promising New Crash Prediction Models Enabled by Iteris’ Application of New Partner Connected Vehicle Data

Today’s connected vehicles (CVs) typically have between 60 and 100 onboard sensors, detecting not just the position of other vehicles but everything from hard braking and sudden acceleration to windshield wiper use and safety belt engagement.
Around 95% of new vehicles are anticipated to be connected by 2030, according to McKinsey, and the data collected by CVs have the potential to significantly mitigate congestion and improve safety along U.S. roadways. The communication systems in CVs can exchange vehicle, journey and geospatial information with smart devices, other vehicles and transportation infrastructure like roadside traffic cabinets.
A new connected vehicle data partnership
Following Iteris’ recent partnership with connected vehicle data leader Wejo, Iteris’ public-sector and commercial customers will gain access to anonymous enhanced CV data to help proactively predict – and ultimately prevent – many types of roadway problems.
Iteris initially studied one month of connected vehicle data from Wejo and compared it with collision data available for signalized intersections and freeways in Tampa (the seat of Hillsborough County, Florida). With Wejo’s North American CV data ingested into Iteris’ ClearMobility™ Cloud, expanded and enhanced crash-prediction modeling is available for public agencies and commercial enterprises in the mobility space to improve intersection safety and freeway performance.
Specifically, Iteris offers new and existing customers nearly real-time, anonymized movement data from more than 11 million CVs within Wejo’s broader supply base of over 50 million connected vehicles in North America.
Case study: Hillsborough County, Florida
The pilot study examined output from Tampa’s Crash Data Management System (CDMS) from January 2018 to June 2020. Meanwhile, crash-prediction models were developed from application of machine learning tools against more than three million journeys made by over 85,000 CVs in February 2020. CV data attributes included location, journey direction and acceleration abnormalities.
Crash predictions based on CV data correlated strongly with the county’s crash data. Most importantly, this predictive value was derived from anonymous vehicle-generated data, and did not require infrastructure investment. Analysis was performed at both signalized intersections and back of queues near freeway bottlenecks.
Predicting crashes at signalized intersections
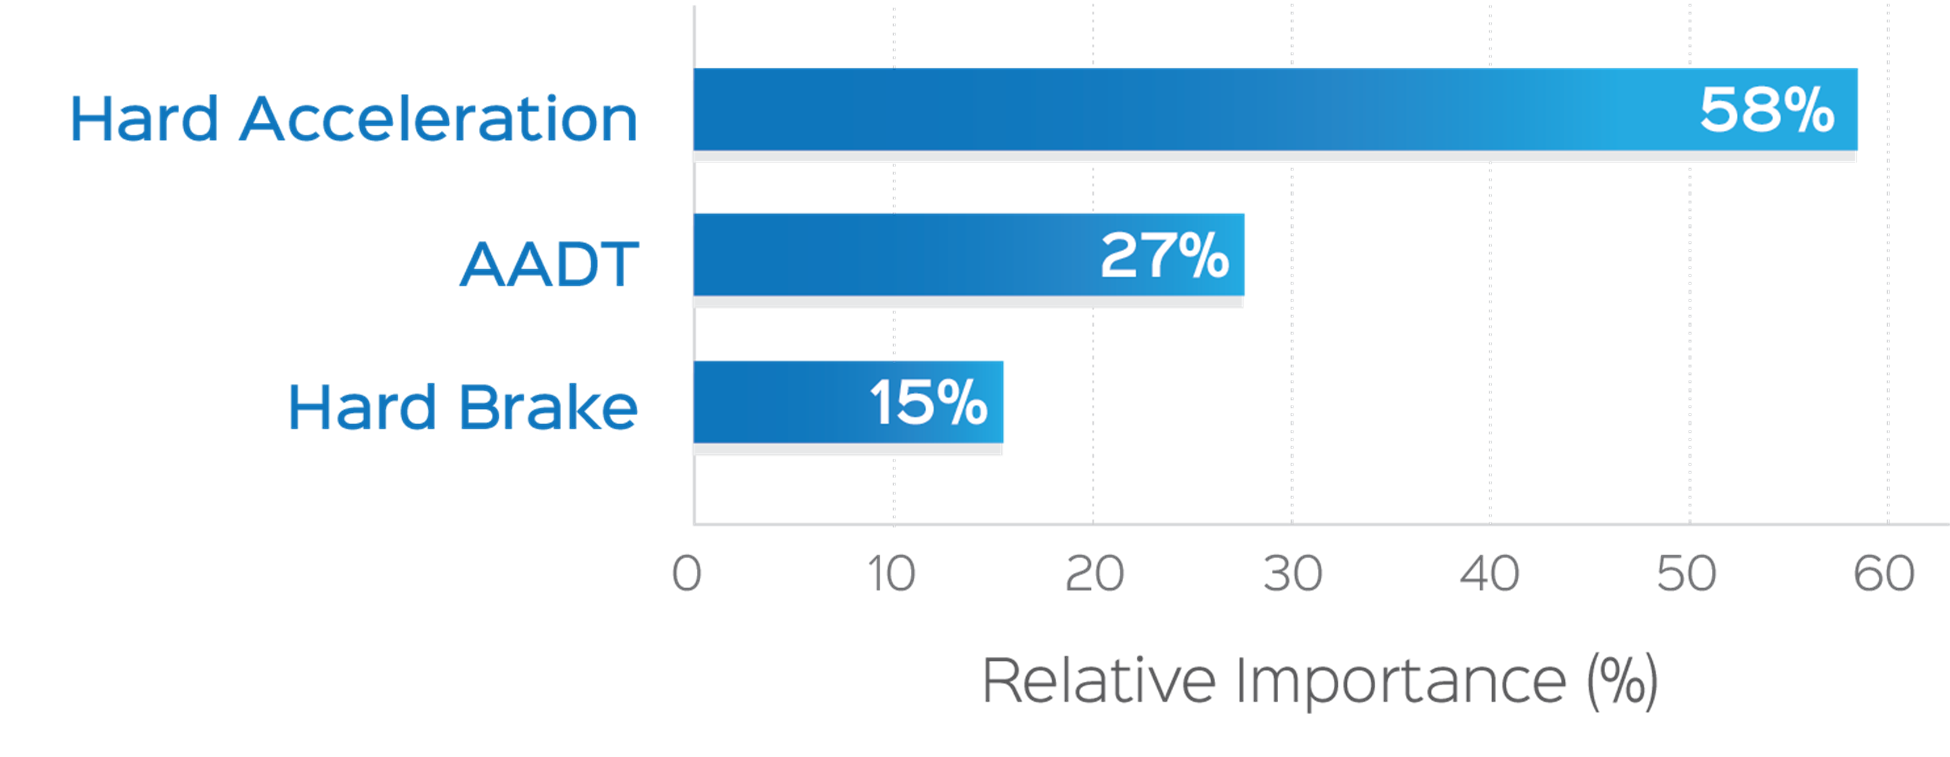
At signalized intersections, Iteris calculated collision risk scores for each intersection using the crash-prediction models. Sudden acceleration had the strongest association with vehicle crashes.
The spatial detail in the data provides insights into intersections and their approach lanes which show the most risky driving behavior. In the pictured intersection (where the lighter colors show acceleration hotspots), there is significant hard acceleration through the eastbound right-turn lane, which also crosses a bike lane.
Hard acceleration at intersections
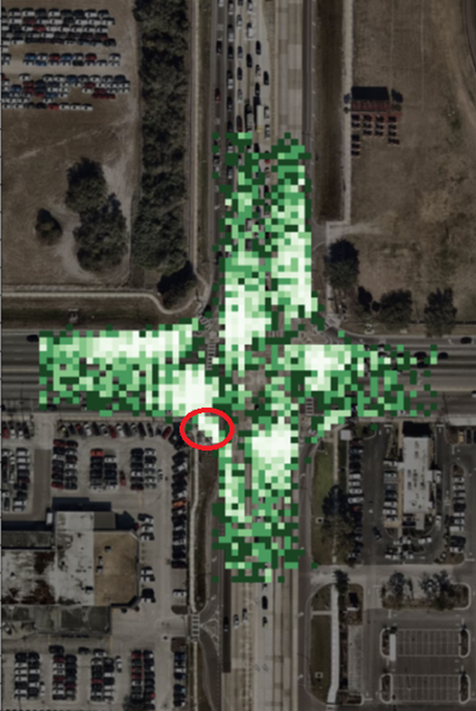
A hard acceleration hotspot occurring through the eastbound right-turn lane.
Analyzing freeway bottlenecks to predict crashes
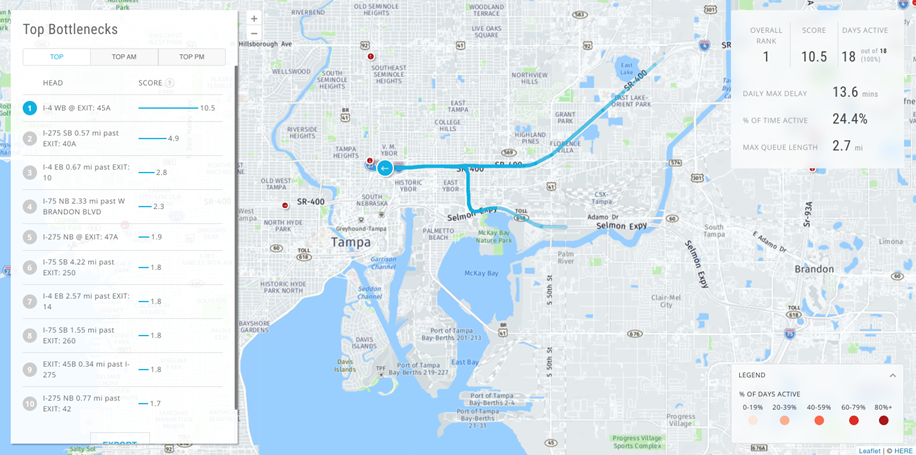
Iteris used its ClearGuide™ Top Bottlenecks report to identify the worst freeway backups in the Tampa region, then developed crash-prediction models in the areas of bottleneck queueing. Visualizing the distributions of serious injury/fatal crashes, hard braking and hard accelerations along the bottleneck queue shows a close correlation.
Top freeway bottlenecks
Serious injury/fatal crashes, hard braking and hard accelerations along the bottleneck queue.
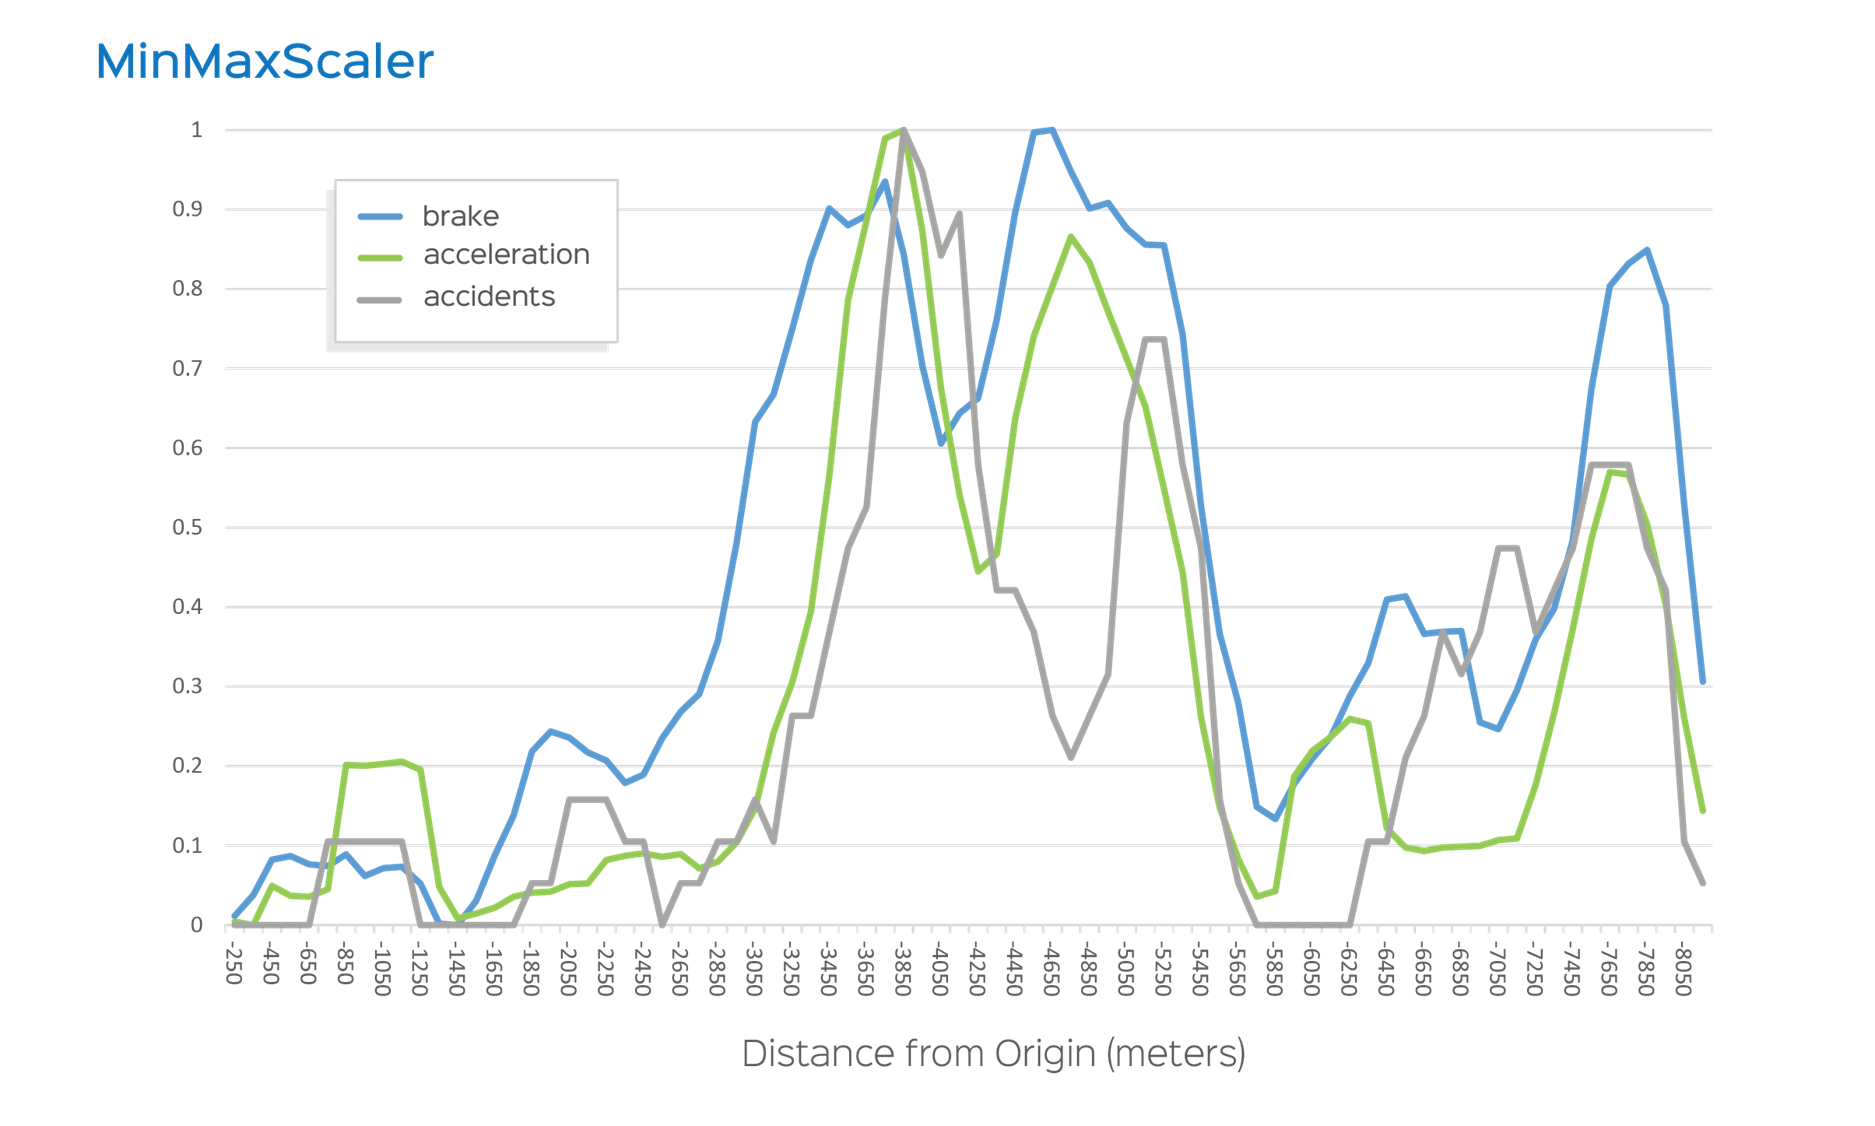
Both hard braking and hard acceleration were highly predictive of serious injury/fatality crashes near freeway bottlenecks, with hard braking showing the strongest predictive power. The case study demonstrates that without infrastructure invesment, agencies can use crash-prediction models on freeways to proactively determine where design or operational changes can reduce hazardous driving approaching bottleneck back of queues.
Takeaways from the Hillsborough case study:
- Hard acceleration patterns at an intersection are highly correlated with the number of crashes
- Hard braking, hard accelerations and annual average daily traffic (AADT) volume can be used to accurately predict the total number of intersection crashes
- Both hard braking and hard acceleration patterns are highly predictive of crashes near bottleneck back of queues
- CV data can be used to quickly find high-risk locations comparable with crash anomalies without infrastructure investment
- Summarizing and visualizing data by approach shows where problem areas exist
Crashes and crash risk
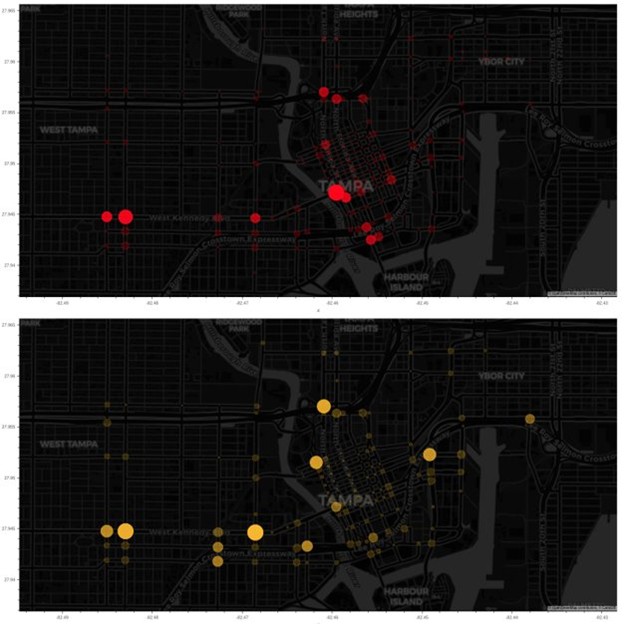
Top: CDMS downtown crash heatmap from January 2018 to June 2020. Bottom: Risk score from Iteris crash-prediction models assessed February 2020.
The study offers great promise for crash-prediction modeling by leveraging CV data from the new Iteris-Wejo partnership. The ability to evaluate the relative importance of traffic volume, hard braking, aggressive acceleration and other factors in crash predictability should help cities significantly improve safety, potentially before problems even occur.
Data sets working together
With additional available tools in Iteris’ ClearMobility Platform, it is possible to explore in greater detail why sudden acceleration is so strongly correlated with vehicle collisions at intersections. For example, by examining the traffic signal controller data, agencies can determine whether the sudden acceleration is most commonly due to red-light running.
Together, signal controller and CV data can help develop a working theory for crash mitigation as well as implement preventive strategies. ClearGuide SPM™ is capable of charting vehicles entering an intersection after the start of yellow to determine possible safety issues with the timing of that signal. Traffic engineers may need to deploy (or adjust) Dilemma Zone detection if too many late yellow or red arrivals are occurring.
More current and future applications of CV data include:
- Safety risk scoring of signalized intersections, school zones, work zones and other areas of interest
- Geo-fencing (e.g., detect speeding within a school zone)
- Real-time incident detection from hard braking data
- Hyperlocal weather data (e.g., windshield wiper use data)
- Vehicle occupancy estimates from seatbelt status data
Creating better policy through better data
One increasingly common provision of bills introduced as part of the Vision Zero roadway safety initiative is the somewhat controversial banning of right turns on red at intersections – particularly around schools, playgrounds, libraries, recreation centers, subway entrances and bike lanes.
Some driver groups oppose that prohibition, arguing that it could lead to drivers moving and turning at higher speeds in order to make the green light. An analysis and risk assessment using CV and signal controller data could help agencies formulate the best policy to maximize safety.
With Wejo joining Iteris’ ecosystem of mobility intelligence providers, Iteris continues to leverage new shared resources and partnerships – in this case, through the insights gained from the ability to process and analyze connected vehicle data – to help agencies achieve safer and more efficient mobility infrastructure.
Iteris is calling for agency partners interested in expanding upon this initial exploratory study to peer review and help build the crash-prediction modeling feature out.
To learn more about Iteris’ Connected and Automated Vehicle Safety Solutions, please click here.
About the Author
Jeff Venables is marketing manager, smart mobility applications at Iteris.
Connect with Jeff Venables on LinkedIn
 X
(Twitter)
 Facebook
 LinkedIn
 Copy
Link
 Email
Email

